
In statistics, the amount of dispersion or variability around an average is termed as Standard Deviation. It is a measure of inconsistency and is recognized as a technical term. Dispersion or variance can be defined as the difference between an actual and an average value. With the increase of the standard deviation, the dispersion or variance increases.
For example, you go to a book shop to buy a book which costs INR 75. You have a 100 rupee note and thus you find that you will get INR 25 in return when you buy the book. You would gladly buy the book. But in terms of the return, you get back INR 20 from the shopkeeper. After further inquiring about the extra cost, you find that it is a hidden charge including GST.
Therefore, the actual return data varies from -10 percent to 60 percent. And that is the reason the charges are kept hidden. So, here INR 25 is the average data and INR 20 is the actual data and INR 5 is the dispersion. So we can find that the actual data got deviated from the average data or the promised return of money. Hence, this is what a standard deviation looks like.
Calculating standard deviation with the help of an example
Let us look at an example to find out about standard deviation. Let us take for instance that a student has scored the following marks in the subjects.
For Mathematics, he got 29 marks. For Geography, he got 24 marks. For Vernacular, he got 27 marks and for Biology, he got 30 marks. Now let us find the average score of marks by adding up the marks in each subject and dividing it by the total number of subjects.
Thus, the average score will be:
(29 + 24 + 27 + 30)/4 = 110/4 = 27.5.
This is also known by the term mean. We have to subtract the average score or mean from the scores he got in each subject. So for Mathematics, the calculation would be 29 – 27.5 = 1.5. For Geography, it would be 24 – 27.5 = -3.5. For Vernacular, it would be 27 – 27.5 = -.5 and for Biology, it would be 30 -27.5 = 2.5.
We now have to square the numbers and add them and later divide them with the number of subjects.
σ2 = {(1.5)^2 + (-3.5)^2 + (-.5)^2 + (2.5)^2} / 4
= (2.25 + 12.25 + .25 + 6.25) / 4 = 21 / 4 = 5.25
This average is known as variance or rather a dispersion and is denoted by the symbol σ^2.
By getting the square root of the variance, we can find the standard deviation.
√ σ^2 = √ 5.25. Thus, σ = 2.29 (approx) which rounds up to 2. This is the standard deviation and is denoted by the symbol σ.
The formula for Standard Deviation
The formula of standard deviation can be stated as follows.
σ = √{Σ(xi – µ) / N
Here σ is the standard deviation, μ is the average value found and xi is the raw value or actual value. Moreover, N resembles the total number of terms. This is also known as population standard deviation.
The formula for standard deviation changes if we use a sample with a bigger proportion. For example, if there are 100 students then it will refer to sample standard deviation.
Thus the formula would be as follows:
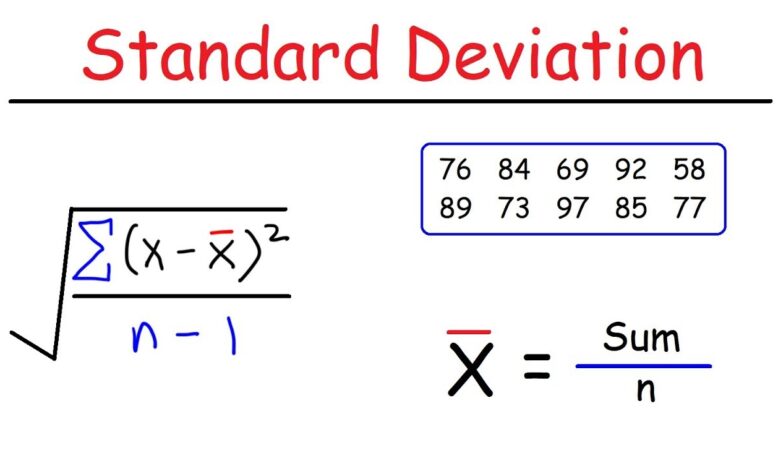
S = √(1/N -1)NΣi=1(xi – x̄)
For further queries and lessons on Standard Deviation, please visit the Cuemath website. Cuemath not only helps you with the fundamentals but also provides in-depth knowledge in the field of Mathematics.
For more valuable information visit the website


